
Over the past few years, I’ve been working on a side project to update the hiking trails map for a small camp. Though the project has taken longer than I anticipated, it has been very rewarding. This past week, I think we finally finished the map. And it was during this last revision process that a thought came to mind: When I am designing a map, am I reviewing it under the same conditions as the user will be looking at the map?
Or put another way: Am I considering the people who will be looking at this map, or interacting with this mobile map application, or using this custom analysis tool? If you’re not, then I want to encourage you to start. If the map will be inserted into a presentation, then create a mock presentation to see how it will look. Will your map be used by tourists walking around the city? Then print your map, go for a walk outside, and see how it looks. Are you building a mobile application? Then visit the site on a couple browsers and your mobile phone. Maybe we cartographers don’t consider ourselves user experience designers. But the truth is, we are. And when we’re developing mobile apps, we’re also user interface designers. That’s what’s great about our profession. We are many things.
If this topic interests you, then consider checking out the slides from the Creating Great Print and Web Maps presentation from the 2018 Esri Federal User Conference. It was one of the best sessions I attended. I wish it was recorded and on YouTube, because I learned so many things from the presenter.

I want to share my personal experience with an example for these three products:
- printed map
- mobile map application
- geoprocesing/analysis tool.
Printed Maps
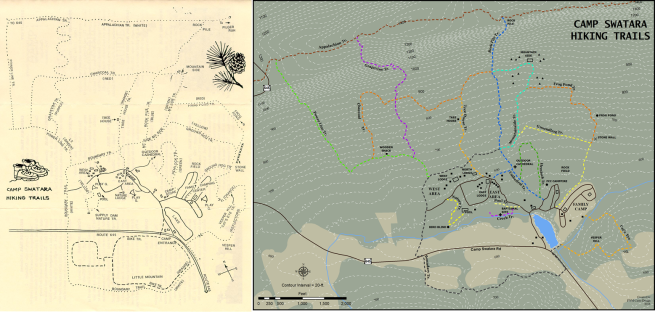
First up is the camp’s hiking trails map. How will people use this map? Some will view it on their computers or mobile devices. Others will print it out and take it along on their hikes. So, my color schemes need to work well for both printed and electronic versions of the map. But I’m going to put a higher priority on the printed use case. For this last revision, I printed the map and took it outside. I looked at it under bright sun, and also under the shade of trees. I wanted to experience the map like the people hiking at the camp will experience it. Honestly, this may have been the first time I tried to engage with a printed map the same way the audience will. It felt great, and I want to do it more often.
I’m glad I did this. There was poor contrast between the white elevation contour lines and the tan area. I also discovered many labels needed to be larger. The end result was a better map. I have a side-by-side comparison between the original map and my redesign. Apart from more accurately mapping the hiking trails, the map is now in color.
Interactive Web Maps
Second, let’s look at interactive web map applications. These might be a web map hosted on a website, or a native mobile app. Thanks to a brief side job I had developing WordPress sites, I learned the importance of viewing websites/apps on multiple browsers and mobile devices. With this company, we used a service called BrowserStack. With products like BrowserStack, you can review your website on desktop browsers for Windows and MacOS, as well as a plethora of Android, iOS, and Windows mobile devices.
I had once approached my boss about purchasing a product like BrowserStack, but he rejected the idea. But I didn’t let that stop me from testing these map apps. Instead, I chose to work with what I had. So I test them on the browsers available on my work computer, on my home computer, on my Android mobile phone, my old iPhone, and my old iPad Mini. It’s not the ideal solution, but it’s better than not testing at all.
And when it comes to deciding which browsers and mobile devices to test, I would recommend testing the browsers and devices that are actually being used for each website/app. We have Google Analytics set for our deployment of web maps. You are able to get statistics on the types of browsers used, the operating systems used, and the mobile devices being used. We are all busy people with many responsibilities. You can get carried away testing on every device possible. But work smart, and focus on the browsers and devices that are actually being used.

In addition to making sure the map apps look good across browsers and devices, I also like to interact with the map the same way a user might. This interactive map was probably developed to help answer some questions or solve some problems. So I’m going to try to answer those questions as I test the map. Is someone trying to figure out where the nearest yard compost facility to their house is? I’ll type in an address, or search a town name in the search bar. Does someone want to find properties that have sold between $150,000 and $300,000 this year, and are located in Mechanicsburg Borough? I’ll use those parameters in our sales search widget for our Property Mapper.
Unlike printed maps, web maps have the added complexity that errors may occur. I want to share a way I tried to improve the user experience when errors occur. Last summer, we were having problems with our map services being down at random times. You might visit one our apps and just see a blank map. I knew this wasn’t good. So I set out to develop a solution that would warn users that some of the layers did not load on the map.
I discuss this process in detail in another article. The solution was for apps that use the Leaflet.js library and associated Esri Leaflet plugins. I created a function that would process the requestsuccess and requesterror events. If all the layers had loaded successfully, I would remove a loading screen. If any of them failed to load, I would display a message to the user.

Here is the code sample for this solution:
This file contains bidirectional Unicode text that may be interpreted or compiled differently than what appears below. To review, open the file in an editor that reveals hidden Unicode characters.
Learn more about bidirectional Unicode characters
| <!– error message modal –> | |
| <div class="modal fade" id="layerErrorModal" tabindex="-1" role="dialog" aria-labelledby="layerErrorModal" aria-hidden="true"> | |
| <div class="modal-dialog"> | |
| <div class="modal-content"> | |
| <div class="modal-header"> | |
| <button type="button" class="close" data-dismiss="modal" aria-hidden="true">×</button> | |
| <h4 class="modal-title" id="myModalLabel">Error Adding Layers</h4> | |
| </div> | |
| <div id="erMsg" class="modal-body"> | |
| <h4 class="text-danger">Warning: One or more layers failed to load on the map!</h4> | |
| </div> | |
| <div class="modal-footer"> | |
| <button type="button" class="btn btn-default" data-dismiss="modal">Close</button> | |
| </div> | |
| </div> <!– /.modal-content –> | |
| </div> <!– /.modal-dialog –> | |
| </div> <!– /.modal –> | |
| <!– / Error message info window –> |
This file contains bidirectional Unicode text that may be interpreted or compiled differently than what appears below. To review, open the file in an editor that reveals hidden Unicode characters.
Learn more about bidirectional Unicode characters
| // Libraries assumed in snippet | |
| // 1. jQuery | |
| // 2. Bootstrap | |
| // 3. Leaflet | |
| // 4. Esri Leaflet | |
| // function to handle load event for map services | |
| function processLoadEvent(service) { | |
| // service request success event | |
| service.on('requestsuccess', function(e) { | |
| // set isLoaded property to true | |
| service.options.isLoaded = true; | |
| }); | |
| // request error event | |
| service.on('requesterror', function(e) { | |
| // if the error url matches the url for the map service, display error messages | |
| // without this logic, various urls related to the service appear | |
| if (e.url == service.options.url) { | |
| // set isLoaded property to false | |
| service.options.isLoaded = false; | |
| // add warning messages to console | |
| console.warn('Layer failed to load: ' + service.options.url); | |
| console.warn('Code: ' + e.code + '; Message: ' + e.message); | |
| // show modal window | |
| $('#layerErrorModal').modal('show'); | |
| } | |
| }); | |
| } | |
| // create a layer from an Esri web service | |
| var mapService = L.esri.featureLayer({ | |
| url: '[doman]/arcgis/rest/MyMapService/0', | |
| isLoaded: false | |
| }); | |
| // call function to process loading | |
| processLoadEvent(mapService); | |
| // add layer to map | |
| mapService.addTo(map); |
Custom Geoprocessing/Analysis Tools
The final scenario I want to discuss is developing custom geoprocessing tools. In my experience, these are typically one or more Python scripts running multiple analysis tools using only a few inputs from a user. They take many manual processes and run them behind the scenes. They are great for repeatable workflows. I have built a few of these tools for GIS users in our Planning and Public Safety departments.
I want to focus on what happens when an error occurs with the tool. Maybe the output dataset has an invalid name, or a layer used in the analysis was accidentally deleted. My concern for errors are twofold: 1) we capture information about the error so we can fix the tool; and 2) we present the error to the user in such a way that it doesn’t confuse or freak them out.
While I had been good at capturing the error, I wasn’t presenting the error very well to the users. Then I ran into a cool error reporting function in the Download ArcGIS Online Feature/Map Service tool. It writes a message that includes the system error, line number of the error, and the file associated with the error. Including the file is especially important when your tool is composed of multiple scripts (where the scripts are used as modules to make the project easier to maintain). I took the logic of this function and added a generic error message informing users to provide our department with the error information. And if they close the tool before telling us, we can always check the geoprocessing history in their map project. Below is the sample code and a screenshot of this error message:
This file contains bidirectional Unicode text that may be interpreted or compiled differently than what appears below. To review, open the file in an editor that reveals hidden Unicode characters.
Learn more about bidirectional Unicode characters
| # this is the file where the logic for your custom tool goes | |
| # import modules | |
| # import errorLogger.py module | |
| import arcpy, sys, errorLogger | |
| # run your tool's code | |
| try: | |
| pass | |
| # your code goes here | |
| # If an error occurs running geoprocessing tool(s) capture error and write message | |
| # handle error outside of Python system | |
| except EnvironmentError as e: | |
| arcpy.AddError('\nAn error occured running this tool. Please provide the GIS Department the following error messages:') | |
| # call error logger method | |
| errorLogger.PrintException(e) | |
| # handle exception error | |
| except Exception as e: | |
| arcpy.AddError('\nAn error occured running this tool. Please provide the GIS Department the following error messages:') | |
| # call error logger method | |
| errorLogger.PrintException(e) | |
| # final clean up actions for script | |
| finally: | |
| pass | |
| # do whatever else needs to be done |
This file contains bidirectional Unicode text that may be interpreted or compiled differently than what appears below. To review, open the file in an editor that reveals hidden Unicode characters.
Learn more about bidirectional Unicode characters
| # import modules | |
| import sys, linecache, arcpy | |
| # Function to handle errors | |
| def PrintException(error): | |
| exc_type, exc_obj, tb = sys.exc_info() | |
| f = tb.tb_frame | |
| lineno = tb.tb_lineno | |
| filename = f.f_code.co_filename | |
| linecache.checkcache(filename) | |
| line = linecache.getline(filename, lineno, f.f_globals) | |
| # add error message with the system error message, line number of error, and the file that the error ocured in | |
| arcpy.AddError('\nerror: {}\nFILE: {}, LINE: {}\n\n\t "{}": {}'.format(error, filename, lineno, line.strip(), exc_obj)) | |
| # exit Python | |
| sys.exit() | |
| # end PrintException |

What About You?
So are you thinking about how people are using your maps? If so, how do you enter their world? What are some cool tools or methods you use in improving the user experience?
If you’re not, what’s holding you back? Think of one small thing you could do to better understand how people are using your maps or mobile apps. How could you improve their experience?
